|
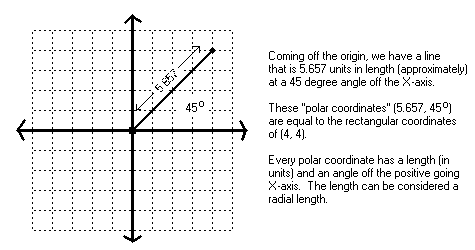
The last thing that we will cover, at least for now, in the realm of graphics primitives is circles. To draw circles, you have to understand angles, radia and be able to do conversions between polar coordinates and rectangular coordinates. This is not really as hard as it sounds because you already know what rectangular coordinates are as well as how to measure angles. Polar coordinates simply allow you to use angles and radial lengths to plot points rather than using the traditional (X, Y) coordinates common with the rectangular coordinate system. Computers, naturally, use (X, Y) coordinates (similar to the standard rectangular coordinates used in math) to plot pixels rather than the polar coordinate system so a polar to rectangular coordinate conversion must be used. To illustrate this, look at the angle on the grid below:

|
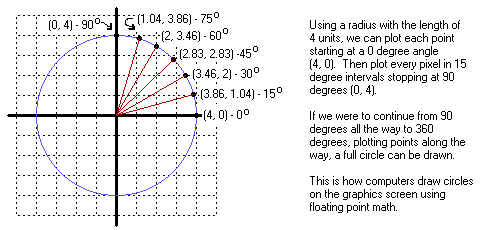
All this may be well and good but we need to use it to draw circles on the graphics screen. Well, imagine the grid as our graphics screen. If we plot the rectangular coordinates of every angle from 0o to 360o with a constant radial length, we would in effect have drawn a circle.

|
We can increment the angle by any number of degrees, not just 15o, but before we can start plotting points on the graphics screen we had better figure out how to convert from polar coordinates to rectangular coordinates. To convert the coordinates, we must solve for both the X and Y values that can be derived from the angle and the radius. Okay, so I guess I will have to give them to you, so here they are:
     X = r x cos(angle)
     Y = r x sin(angle)
Yes, this requires two trigonometric, sine and cosine, functions and it is really as simple as it looks. Using it on the graphics screen requires some adjustment to these formulas, but not much. It really has to do with the coordinates to the center of the circle. When you use polar to rectangular coordinate conversion formulas, they assume that the center of the circle is at coordinates (0, 0), the origin. Since the coordinates (0, 0) on the graphics screen are the upper left corner of the screen, not the center, we naturally want to adjust the center coordinates of the circle off (0, 0). Otherwise, we would only see parts of the circles drawn in the upper left corner of the screen (and that would not be good). To adjust the center of the circle, just simply offset (add to) the values derived from the polar to rectangular coordinate conversion formulas. To see how this works, let's go ahead and write a simple function in C that draws circles.
     #include <math.h>            /* Needed for sin and cos functions */

     void Circle(int xOffset, int yOffset, int radius, unsigned char C)
     {
          float xPlot, yPlot;     /* Current pixel being plotted */
          float angle, angleRad;  /* Current angle degrees & radiens */

          for (angle = 0.; angle < 360.; angle += 1) {

               /* Convert degrees to radiens */
               angleRad = angle * (3.141592654 / 180);

               /* Convert polar to rectangular coordinates */
               xPlot = (radius * cos(angleRad)) + xOffset;
               yPlot = (radius * sin(angleRad)) + yOffset;

               /* Check boundaries */
               if (xPlot < 0)
                    xPlot = 0;
               else if (xPlot >= ScreenWidth)
                    xPlot = ScreenWidth - 1;

               if (yPlot < 0)
                    yPlot = 0;
               else if (yPlot >= ScreenHeight)
                    yPlot = ScreenHeight - 1;

               /* Plot the pixel on the graphics screen */
               SetPixel((int)xPlot, (int)yPlot, C);
          }
     }
That's pretty much it when it comes to drawing basic circles on the graphics screen. This function may draw circles that appear broken up. The way to remedy this is to change the 'for' statement so that it increments by .5 degrees per iteration rather than 1 degree, like so:
for (angle = 0; angle < 360; angle += 0.5) {
The smaller you make the increment, the less broken up the circle will appear. Be careful, though, not to make the increment too small because the smaller the number, the longer it takes to draw the circle. An increment of 0.5 seems to be the best bet but you may want to experiment a bit for best results.